Refer to the figure.
Figure 6
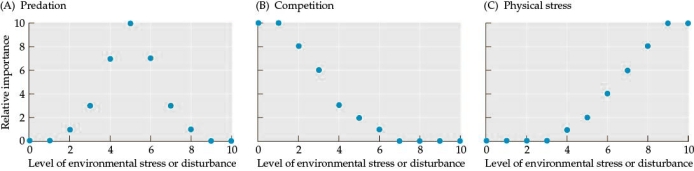 You are studying a new area to determine how disturbances affect species diversity. You study the impact of several different types of stress or disturbance on species diversity (predation, competition, and physical stress) in a community in your study area. You collect data on the relative importance of each type of stress/disturbance. The data are shown in Figure 6. Sketch a line connecting the points in the scatter plots to indicate the relationship between stress/disturbance and the relative importance of each factor in Figures A-C. Determine how your data differ from predictions of the Menge-Sutherland Model. Which factor(s) differ from predictions? On the figures, indicate a factor that differs with a curve that represents the actual prediction from the model (this will be referred to as Figure 7).
Correct Answer:
Verified
View Answer
Unlock this answer now
Get Access to more Verified Answers free of charge

Unlock this Answer For Free Now!
View this answer and more for free by performing one of the following actions

Scan the QR code to install the App and get 2 free unlocks

Unlock quizzes for free by uploading documents