Refer to the table.
Table 1
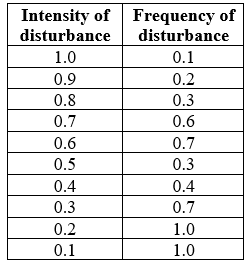 You are studying a new area to determine how disturbances affect species diversity. You collect data on the intensity and frequency of disturbances in your study area, as shown in Table 1. Use the data in the table to answer the following questions:
a) Graph the relationship between intensity of disturbance and frequency of disturbance as a scatter plot (this will be referred to as Figure 4).
b) Which type of disturbance occurs more frequently? Which type of disturbance is more unusual? Which type of disturbance occurs at moderate frequencies?
c) Based on your answer to (a) and your knowledge of Joseph Connell's disturbance hypothesis (as described in the textbook), under which condition would you expect species diversity to be highest? State the name of this hypothesis, describe your prediction, and circle this area on the scatter plot you created to answer (a) (this will be referred to as Figure 5).
d) What additional data would you require and what modifications would you make to properly examine how your study system fits the predictions of the dynamic equilibrium model?
Correct Answer:
Verified
Figure 4
View Answer
Unlock this answer now
Get Access to more Verified Answers free of charge
Q49: Refer to the figures.
Figure 1

Q50: Refer to the figures.
Figure 1
Q51: Refer to the figures.
Figure 1
Unlock this Answer For Free Now!
View this answer and more for free by performing one of the following actions

Scan the QR code to install the App and get 2 free unlocks

Unlock quizzes for free by uploading documents