Refer to the tables and figure.
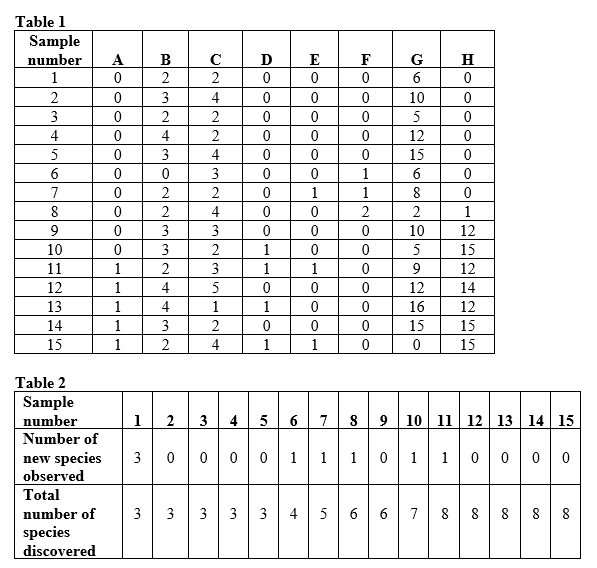 Figure 1
 Suppose you are researching an ecological community in a new study area. You divide your study area into quadrats and sample one quadrat a day to determine the species that occupy the area and how many individuals of these species are present. Assume that by the end of your sampling efforts, you have identified all of the species that occur in the study area. Use Table 1, Table 2, and Figure 1 to answer the following questions:
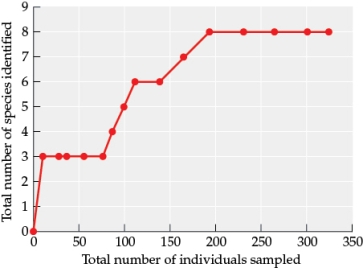
a) In community ecology studies, what is the relationship that you graphed in Figure 1 commonly called?
b) Which species community measure did you plot on the y-axis of the graph?
c) What percentage of the total individuals did you have to sample before you identified all of the species in your study area?
d) How many quadrats did you have to sample before you identified all of the species in your study area?
Correct Answer:
Verified
View Answer
Unlock this answer now
Get Access to more Verified Answers free of charge
Q43: Estimates show that oceans absorb about _
Q44: Alsterberg and colleagues showed that with ocean
Q45: Which technique was used to determine the
Q46: Refer to the table.
Table 1

Q47: Refer to the tables. Q49: Refer to the table and the figure. Q50: Refer to the table. Q51: Refer to the tables and the figure. Q52: Refer to the table and figure. Q53: Refer to the tables.
![]()
Table
Table 3: Species Abundance
![]()
Unlock this Answer For Free Now!
View this answer and more for free by performing one of the following actions

Scan the QR code to install the App and get 2 free unlocks

Unlock quizzes for free by uploading documents