Refer to the tables and the figure.
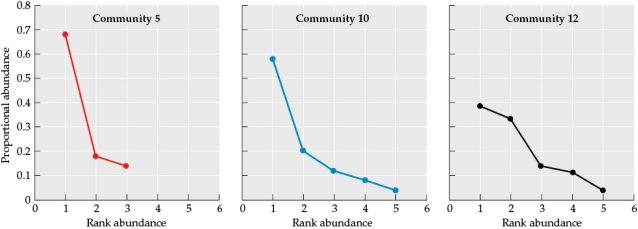
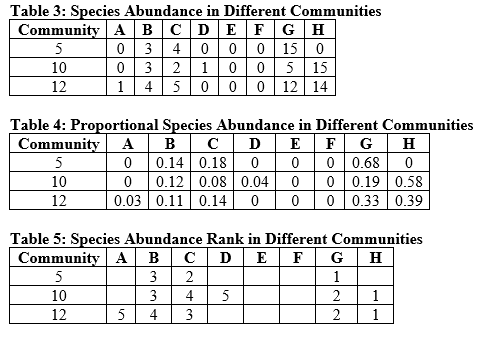 Figure 3
 Suppose you are researching an ecological community in a new study area. You divide your study area into quadrats and sample one quadrat a day to determine the species that occupy the area and how many individuals of these species are present. Assume that by the end of your sampling efforts, you have identified all of the species that occur in the study area. Use Tables 3, 4, and 5 as well as Figure 3 to answer the following questions:
a) Which species is most common in each community?
b) Which species is the rarest in each community?
c) Are the same species always common and always rare, or is there variation?
d) How are communities 5 and 10 similar? How do they differ? Consider species composition, proportion, abundance, and richness in your answer.
e) How are communities 10 and 12 similar? How do they differ? Consider species composition, abundance, and richness in your answer.
Correct Answer:
Verified
View Answer
Unlock this answer now
Get Access to more Verified Answers free of charge
Q46: Refer to the table.
Table 1

Q47: Refer to the tables. Q48: Refer to the tables and figure. Q49: Refer to the table and the figure. Q50: Refer to the table. Q52: Refer to the table and figure. Q53: Refer to the tables. Q54: Refer to the table. Q55: Refer to the table. Q56: Refer to the table and the figure.
![]()
Table
Table 3: Species Abundance
![]()
Table 9
Table 10
Table
Unlock this Answer For Free Now!
View this answer and more for free by performing one of the following actions

Scan the QR code to install the App and get 2 free unlocks

Unlock quizzes for free by uploading documents