Multiple Choice
Refer to the figure.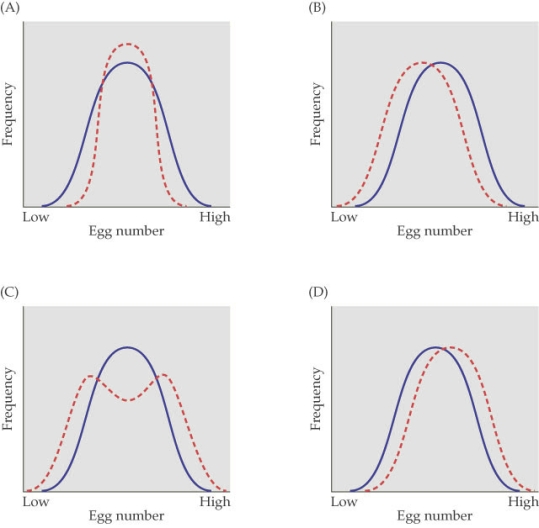
- The figure shows four cases of selection on egg number in a population of flour beetles. The solid blue line represents the frequency of the original population and the dashed red line represents the frequency distribution after eight generations. Which figure most likely represents a case of disruptive selection?
A) Figure A
B) Figure B
C) Figure C
D) Figure D
Correct Answer:
Verified
Related Questions

