Multiple Choice
Refer to the figure.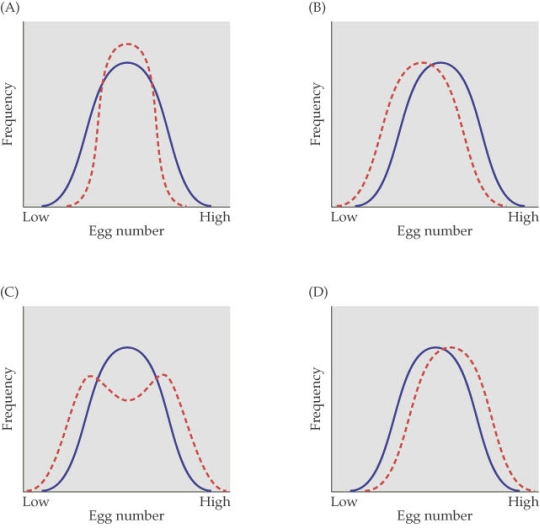
- The figure shows four cases of selection on egg number in a population of flour beetles. The solid blue line represents the frequency of the original population and the dashed red line represents the frequency distribution after eight generations. In which figure did the variance within the population for egg laying increase the most?
A) Figure A
B) Figure B
C) Figure C
D) Figure D
Correct Answer:
Verified
Related Questions
Q13: The mutation rate of a gene involved
Q14: After large seeds became more common, the

