Solved
Figure 91 Shows the Relationship Between Respondents' Racial/ethnic Identity (RACEHISP) and and Their
Multiple Choice
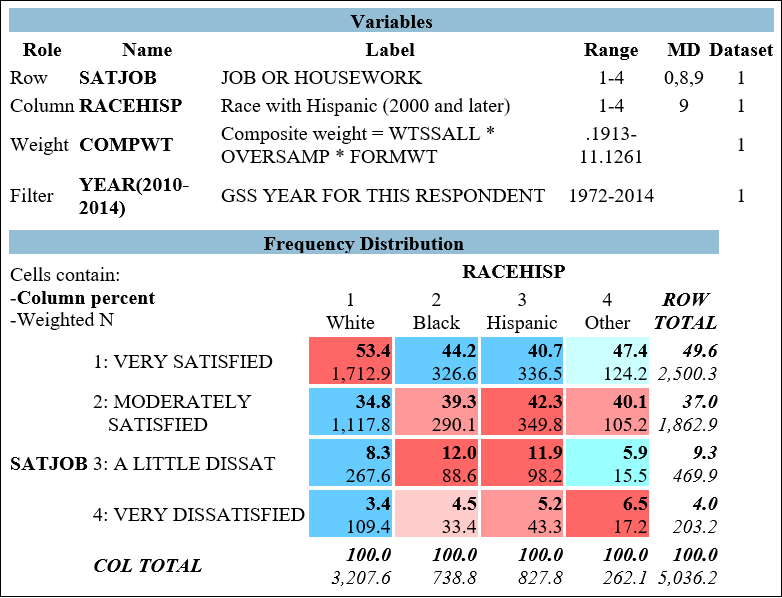 Figure 9.1 shows the relationship between respondents' racial/ethnic identity (RACEHISP) and their job satisfaction (SATJOB) . produce a cross-tab that examines the relationship between the variables SATJOB and RACEHISP. Put SATJOB in the "Row" field and RACEHISP in the "Column" field. In the "Filter" field, type "YEAR (2010-2014) ."
-The variable SATJOB is best described as:
A) a categorical-level variable.
B) an ordinal-level variable.
C) an interval-ratio-level variable.
D) a dummy variable.
Correct Answer:
Verified
Related Questions

