Use Figure: Profit-Maximizing Quantity and Price. The figure depicts the demand curve, marginal revenue curve, and marginal cost curve that are facing a monopolist. Assume that the monopolist is operating at its profit-maximizing point. If the total profit of the monopolist is $200, then the average total cost of production is:
Figure: Profit-Maximizing Quantity and Price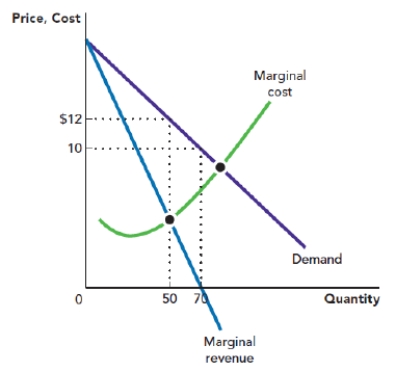
A) $5.
B) $6.
C) $7.
D) $8.
Correct Answer:
Verified
Q31: Suppose that a monopolist is operating at
Q32: Suppose that a monopolist is operating at
Q33: A monopolist's profit is maximized at the
Q34: Use Figure: Profit-Maximizing Quantity and Price. The
Q35: Use Figure: Profit-Maximizing Quantity and Price. The
Q37: Use Figure: Profit-Maximizing Quantity and Price. The
Q38: Suppose that a monopoly firm is operating
Q39: Use Figure: Monopoly Profit Maximization. The figure
Q40: Use Figure: Monopoly Profit Maximization. The figure
Q41: Use Figure: Monopoly Profit Maximization. The figure
Unlock this Answer For Free Now!
View this answer and more for free by performing one of the following actions

Scan the QR code to install the App and get 2 free unlocks

Unlock quizzes for free by uploading documents