Use Figure: Monopoly Profit Maximization. The figure shows the demand curve, marginal revenue curve, marginal cost curve, and average total cost curve that are faced by a monopolist. Suppose that the firm is operating at its profit-maximizing point. The profit per unit for the firm is_____, and the total profit is:
Figure: Monopoly Profit Maximization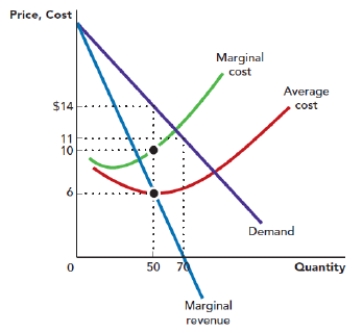
A) $4; $560.
B) $4; $280.
C) $8; $700.
D) $8; $400.
Correct Answer:
Verified
Q36: Use Figure: Profit-Maximizing Quantity and Price. The
Q37: Use Figure: Profit-Maximizing Quantity and Price. The
Q38: Suppose that a monopoly firm is operating
Q39: Use Figure: Monopoly Profit Maximization. The figure
Q40: Use Figure: Monopoly Profit Maximization. The figure
Q42: Use Figure: Monopoly Profit Maximization. The figure
Q43: Resource allocation is efficient from a societal
Q44: Resource allocation is efficient from a societal
Q45: Because a monopolist charges a price that
Q46: A perfectly competitive market produces a _
Unlock this Answer For Free Now!
View this answer and more for free by performing one of the following actions

Scan the QR code to install the App and get 2 free unlocks

Unlock quizzes for free by uploading documents