Use the figure The Supply Curve. What caused the change from point L to point M in this graph?
Figure: The Supply Curve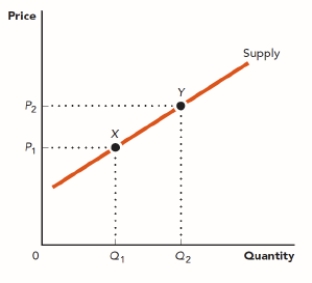
A) The price of this good increased.
B) The price of this good decreased.
C) The cost of resources used in producing this good decreased.
D) The number of sellers of this good increased.
Correct Answer:
Verified
Q20: What causes a movement to the right
Q21: Ezra produces cotton candy that he sells
Q22: How do you represent a seller's willingness
Q23: Use the figure The Supply Curve. What
Q24: Use the figure The Supply Curve. What
Q26: Use the figure The Supply Curve. What
Q27: Use the figure The Supply Curve II.
Q28: Which of the following does NOT cause
Q29: Which of the following does NOT cause
Q30: Which of the following does NOT cause
Unlock this Answer For Free Now!
View this answer and more for free by performing one of the following actions

Scan the QR code to install the App and get 2 free unlocks

Unlock quizzes for free by uploading documents