Use the figure The Supply Curve II. What is represented by the change shown in this graph?
Figure: The Supply Curve II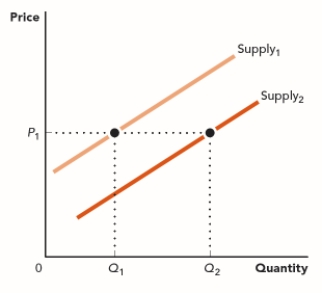
A) a decrease in quantity supplied
B) an increase in quantity supplied
C) an increase in supply
D) a decrease in supply
Correct Answer:
Verified
Q22: How do you represent a seller's willingness
Q23: Use the figure The Supply Curve. What
Q24: Use the figure The Supply Curve. What
Q25: Use the figure The Supply Curve. What
Q26: Use the figure The Supply Curve. What
Q28: Which of the following does NOT cause
Q29: Which of the following does NOT cause
Q30: Which of the following does NOT cause
Q31: Which of the following would cause a
Q32: Which of the following would cause an
Unlock this Answer For Free Now!
View this answer and more for free by performing one of the following actions

Scan the QR code to install the App and get 2 free unlocks

Unlock quizzes for free by uploading documents