Use the figure The Supply Curve. Which of the following changes would NOT cause the change shown in this graph?
Figure: The Supply Curve II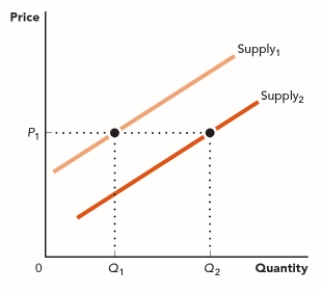
A) lower input costs
B) improved technology
C) a higher price for this good
D) lower regulations for this industry
Correct Answer:
Verified
Q28: Which of the following does NOT cause
Q29: Which of the following does NOT cause
Q30: Which of the following does NOT cause
Q31: Which of the following would cause a
Q32: Which of the following would cause an
Q34: Use the figure The Supply of Radishes.
Q35: Use the figure The Supply of Radishes.
Q36: Which of the following would shift the
Q37: Which of the following would decrease the
Q38: Economists who study the market for rubber
Unlock this Answer For Free Now!
View this answer and more for free by performing one of the following actions

Scan the QR code to install the App and get 2 free unlocks

Unlock quizzes for free by uploading documents