Use the figure The Supply of Radishes. Which of the following changes would cause the movement shown in this graph?
Figure: The Supply of Radishes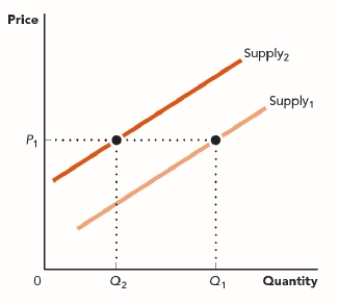
A) higher wages for radish pickers
B) reduced regulation of radish farms
C) improved technology for radish harvesting
D) an elimination of radish pests
Correct Answer:
Verified
Q30: Which of the following does NOT cause
Q31: Which of the following would cause a
Q32: Which of the following would cause an
Q33: Use the figure The Supply Curve. Which
Q34: Use the figure The Supply of Radishes.
Q36: Which of the following would shift the
Q37: Which of the following would decrease the
Q38: Economists who study the market for rubber
Q39: Industry analysts for the pumpkin spice muffin
Q40: Use the figure The Supply of Candles.
Unlock this Answer For Free Now!
View this answer and more for free by performing one of the following actions

Scan the QR code to install the App and get 2 free unlocks

Unlock quizzes for free by uploading documents