Use the figure The Supply of Candles. Which of the following changes would cause the change in supply shown in this graph?
Figure: The Supply of Candles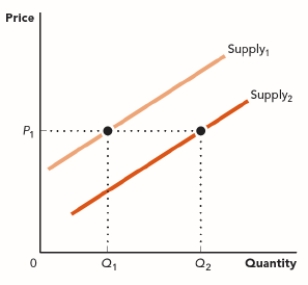
A) a worker shortage in the candle-making industry
B) stricter safety regulation in the candle-making industry
C) higher prices for wax, which is used to produce candles
D) expectations of a lower price for candles in the future
Correct Answer:
Verified
Q35: Use the figure The Supply of Radishes.
Q36: Which of the following would shift the
Q37: Which of the following would decrease the
Q38: Economists who study the market for rubber
Q39: Industry analysts for the pumpkin spice muffin
Q41: The temporary storage of goods by firms
Q42: A firm that expects lower prices in
Q43: Janet has an inventory of 100 houseplants.
Q44: When a firm holds goods in temporary
Q45: A drought in California, a region known
Unlock this Answer For Free Now!
View this answer and more for free by performing one of the following actions

Scan the QR code to install the App and get 2 free unlocks

Unlock quizzes for free by uploading documents