Choose the correct interpretation of the charts below. (Note: The x-axes represent the benefit; the y-axes represent the utility.)
Chart A Chart B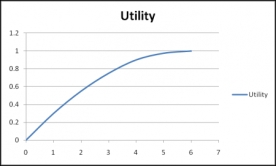
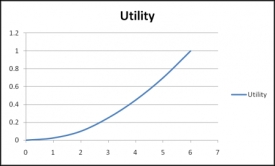
A) Chart A represents risk-aversion and chart B represents risk-neutral.
B) Chart A represents risk-prone and chart B represents risk-aversion.
C) Chart A represents risk-prone and chart B represents risk-sensitive.
D) Chart A represent risk- aversion and chart B represents risk-prone.
E) Both chart A and chart B show risk-aversion.
Correct Answer:
Verified
Q8: Which of the following statements about risk-sensitivity
Q9: On March 11, 2011, an earthquake and
Q10: People tend to be risk-averse when
A) paying
Q11: An investor is faced with the option
Q12: A community is faced with making a
Q14: Some environmental scientists have interviewed residents in
Q15: Referring to the graph below, which of
Q16: Community activists want to get residents of
Q17: When a situation is presented in such
Q18: When decision-making is influenced by a recent
Unlock this Answer For Free Now!
View this answer and more for free by performing one of the following actions

Scan the QR code to install the App and get 2 free unlocks

Unlock quizzes for free by uploading documents