(Figure: Demand Shock A) When the economy moves from A to B, as shown in the graph on the left, how will inflation and the unemployment rate be affected, as shown in the graph on the right?
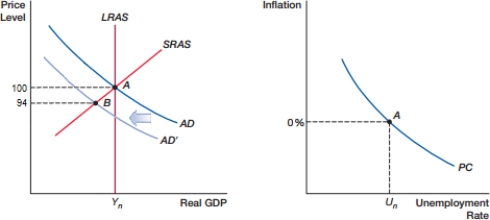
A) There will be movement on the curve, so that inflation increases and unemployment decreases.
B) There will be movement on the curve, so that inflation decreases and unemployment increases.
C) The curve will shift left, so that both unemployment and inflation decrease.
D) The curve will shift right, so that both unemployment and inflation increase.
Correct Answer:
Verified
Q71: Which of the following is NOT likely
Q72: Why will business firms lay off workers
Q73: When central bank policies are credible, then
Q74: (Figure: Demand Shock 0) When the economy
Q75: (Figure: Demand Shock I) The movement shown
Q77: (Figure: Demand Shock Alpha) The movement shown
Q78: (Figure: Expectations 0) In the figure, what
Q79: (Figure: Expectations 0) In the figure, what
Q80: (Figure: Expectations 0) In the figure, what
Q81: (Figure: Expectations A) In the figure, what
Unlock this Answer For Free Now!
View this answer and more for free by performing one of the following actions

Scan the QR code to install the App and get 2 free unlocks

Unlock quizzes for free by uploading documents