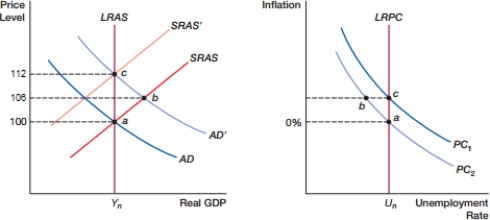
(Figure: Expectations 0) In the figure, what is the cause of the movement from point b to c?

A) positive demand shock
B) negative demand shock
C) self-correcting mechanism
D) inflation expectations
Correct Answer:
Verified
Q74: (Figure: Demand Shock 0) When the economy
Q75: (Figure: Demand Shock I) The movement shown
Q76: (Figure: Demand Shock A) When the economy
Q77: (Figure: Demand Shock Alpha) The movement shown
Q78: (Figure: Expectations 0) In the figure, what
Q80: (Figure: Expectations 0) In the figure, what
Q81: (Figure: Expectations A) In the figure, what
Q82: (Figure: Expectations A) In the figure, what
Q83: (Figure: Expectations A) In the figure, what
Q84: According to the Fisher effect, which of
Unlock this Answer For Free Now!
View this answer and more for free by performing one of the following actions

Scan the QR code to install the App and get 2 free unlocks

Unlock quizzes for free by uploading documents