(Figure: Long-Run and Short-Run Average Total Cost Curves) In the figure, which level of output represents minimum efficient scale?
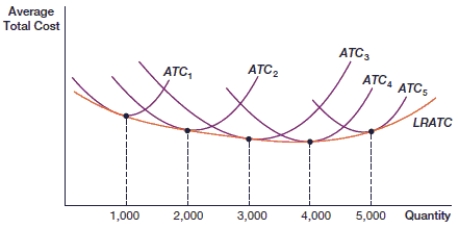
A) 2000
B) 3000
C) 4000
D) 5000
Correct Answer:
Verified
Q98: According to _, marginal cost increases as
Q99: As additional workers are hired, the _
Q100: The _ total cost curve is the
Q101: (Figure: Long-Run and Short-Run Average Total Cost
Q102: (Figure: Long-Run and Short-Run Average Total Cost
Q104: (Figure: Long-Run and Short-Run Average Total Cost
Q105: (Figure: Long-Run and Short-Run Average Total Cost
Q106: (Figure: Long-Run and Short-Run Average Total Cost
Q107: (Figure: Long-Run and Short-Run Average Total Cost
Q108: (Figure: Long-Run and Short-Run Average Total Cost
Unlock this Answer For Free Now!
View this answer and more for free by performing one of the following actions

Scan the QR code to install the App and get 2 free unlocks

Unlock quizzes for free by uploading documents