(Figure: Long-Run and Short-Run Average Total Cost Curves) In the figure, at 3,000 units of output, the firm is experiencing:
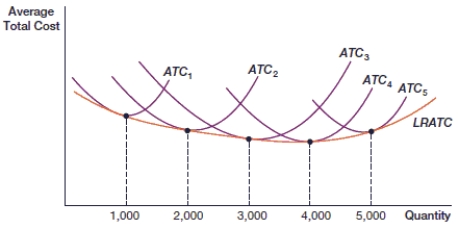
A) economies of scale
B) constant returns to scale
C) minimum efficient scale
D) diseconomies of scale
Correct Answer:
Verified
Q100: The _ total cost curve is the
Q101: (Figure: Long-Run and Short-Run Average Total Cost
Q102: (Figure: Long-Run and Short-Run Average Total Cost
Q103: (Figure: Long-Run and Short-Run Average Total Cost
Q104: (Figure: Long-Run and Short-Run Average Total Cost
Q106: (Figure: Long-Run and Short-Run Average Total Cost
Q107: (Figure: Long-Run and Short-Run Average Total Cost
Q108: (Figure: Long-Run and Short-Run Average Total Cost
Q109: _ occur when long-run average cost declines
Q110: _ is the point at which businesses
Unlock this Answer For Free Now!
View this answer and more for free by performing one of the following actions

Scan the QR code to install the App and get 2 free unlocks

Unlock quizzes for free by uploading documents