(Figure: Economic Impact of Taxation) In the figure, what area represents the deadweight loss from the tax?
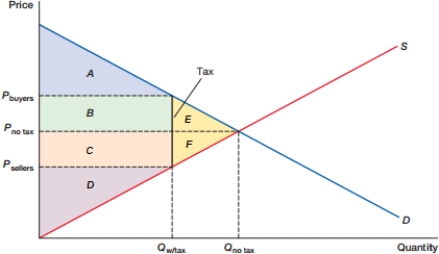
A) A + B
B) B + C
C) C + D
D) E + F
Correct Answer:
Verified
Q42: (Figure: Economic Impact of Taxation) In the
Q43: (Figure: Economic Impact of Taxation) In the
Q44: (Figure: Economic Impact of Taxation) In the
Q45: (Figure: Economic Impact of Taxation) In the
Q46: (Figure: Economic Impact of Taxation) 
Q48: The goal of a sales tax is
Q49: (Figure: Changing Tax Rates) The figure shows
Q50: (Figure: Changing Tax Rates 0) In the
Q51: (Figure: Changing Tax Rates A) In the
Q52: (Figure: Changing Tax Rates I) In the
Unlock this Answer For Free Now!
View this answer and more for free by performing one of the following actions

Scan the QR code to install the App and get 2 free unlocks

Unlock quizzes for free by uploading documents