The interaction plot shown most likely represents which of the following?
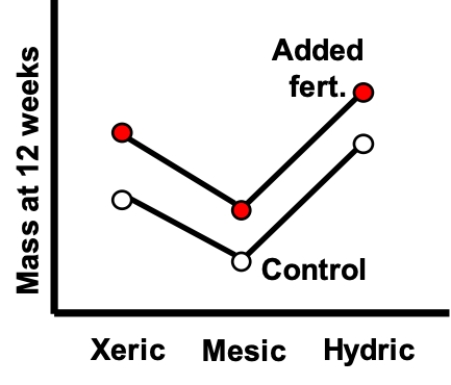
A) An association with environment, but no effect of fertilizer treatment or any interaction
B) An association with fertilizer treatment, but no association with environment or any interaction
C) Associations with environment and fertilizer treatment, and an interaction
D) Associations with environment and fertilizer treatment, but no interaction
Correct Answer:
Verified
Q9: A two-factor ANOVA analysis using a factorial
Q10: The interaction plot shown most likely represents
Q11: The interaction plot shown most likely represents
Q12: The interaction plot shown most likely represents
Q13: The interaction plot shown most likely represents
Q15: The interaction plot shown most likely represents
Q16: The interaction plot shown most likely represents
Q17: The interaction plot shown most likely represents
Q18: The interaction plot shown most likely represents
Q19: For the figure shown, which of the
Unlock this Answer For Free Now!
View this answer and more for free by performing one of the following actions

Scan the QR code to install the App and get 2 free unlocks

Unlock quizzes for free by uploading documents