The interaction plot shown most likely represents which of the following?
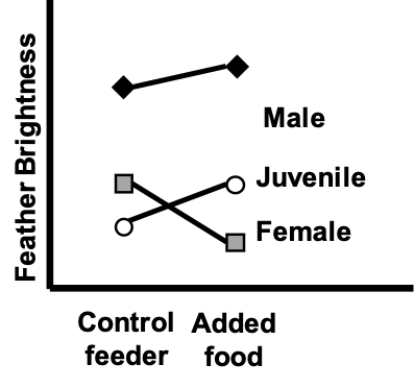
A) Associations with diet and bird age/sex, and an interaction
B) Associations with diet and bird age/sex treatment, but no interaction
C) An association with diet and an interaction, but no effect of bird age/sex
D) An association with bird age/sex and an interaction, but no effect of diet
Correct Answer:
Verified
Q12: The interaction plot shown most likely represents
Q13: The interaction plot shown most likely represents
Q14: The interaction plot shown most likely represents
Q15: The interaction plot shown most likely represents
Q16: The interaction plot shown most likely represents
Q18: The interaction plot shown most likely represents
Q19: For the figure shown, which of the
Q20: For the figure shown, which of the
Q21: Consider an experiment using birds in which
Q22: In the preliminary stages of an ANCOVA
Unlock this Answer For Free Now!
View this answer and more for free by performing one of the following actions

Scan the QR code to install the App and get 2 free unlocks

Unlock quizzes for free by uploading documents