(Figure: Market for a Network Good 2) The graph depicts the market for a network good. What point represents the tipping point?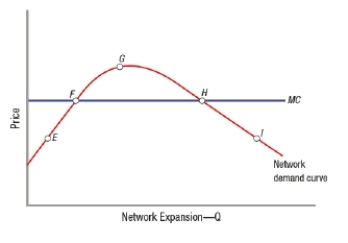
A) E
B) F
C) G
D) H
Correct Answer:
Verified
Q80: (Figure: Market Equilibrium for a Network Good)
Q81: (Figure: Market Equilibrium for a Network Good)
Q82: (Figure: Market Equilibrium for a Network Good)
Q83: (Figure: Market Equilibrium for a Network Good)
Q84: (Figure: Market for a Network Good 2)
Q86: (Figure: Market for a Network Good 2)
Q87: (Figure: Market for a Network Good 2)
Q88: (Figure: Market for a Network Good 2)
Q89: (Figure: Market for a Network Good 2)
Q90: Which of these has lost market share
Unlock this Answer For Free Now!
View this answer and more for free by performing one of the following actions

Scan the QR code to install the App and get 2 free unlocks

Unlock quizzes for free by uploading documents