(Figure: Market for a Network Good 2) The graph depicts the market for a network good. Point _____ represents equilibrium after a _____ cycle takes hold.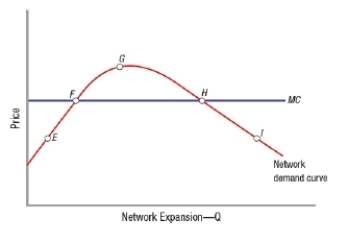
A) F; vicious
B) F; virtuous
C) H; vicious
D) H; virtuous
Correct Answer:
Verified
Q83: (Figure: Market Equilibrium for a Network Good)
Q84: (Figure: Market for a Network Good 2)
Q85: (Figure: Market for a Network Good 2)
Q86: (Figure: Market for a Network Good 2)
Q87: (Figure: Market for a Network Good 2)
Q89: (Figure: Market for a Network Good 2)
Q90: Which of these has lost market share
Q91: Which of these has gained market share
Q92: Why are marginal costs typically low for
Q93: Which statement describes the tipping point in
Unlock this Answer For Free Now!
View this answer and more for free by performing one of the following actions

Scan the QR code to install the App and get 2 free unlocks

Unlock quizzes for free by uploading documents