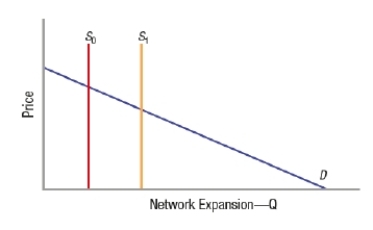
(Figure: Network Goods and Fixed Capacities) The graph represents a small network with a fixed capacity. If capacity decreases from S1 to S0, D rotates downward, and price decreases.
Correct Answer:
Verified
Q197: The short-run supply curve for a network
Q198: The short-run supply curve for a network
Q199: The short-run supply curve for a network
Q200: The short-run supply curve for a network
Q201: (Figure: Network Goods and Fixed Capacities) The
Q203: An increase in supply leads to an
Q204: An increase in supply leads to a
Q205: (Figure: Network Market Curves) Based on the
Q206: (Figure: Network Market Curves) Based on the
Q207: (Figure: Network Market Curves) Based on the
Unlock this Answer For Free Now!
View this answer and more for free by performing one of the following actions

Scan the QR code to install the App and get 2 free unlocks

Unlock quizzes for free by uploading documents