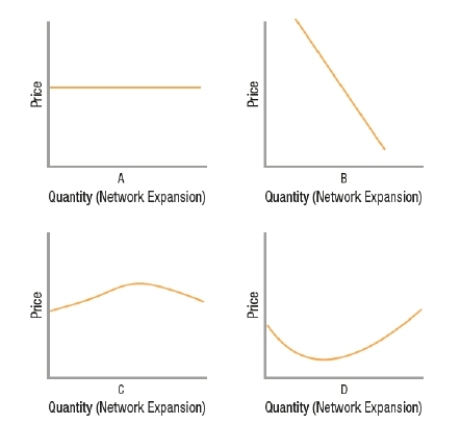
(Figure: Network Market Curves) Based on the graphs, the curve marked D represents the demand curve for a network good.
Correct Answer:
Verified
Q200: The short-run supply curve for a network
Q201: (Figure: Network Goods and Fixed Capacities) The
Q202: (Figure: Network Goods and Fixed Capacities) The
Q203: An increase in supply leads to an
Q204: An increase in supply leads to a
Q206: (Figure: Network Market Curves) Based on the
Q207: (Figure: Network Market Curves) Based on the
Q208: (Figure: Market Demand Curve) The graph depicts
Q209: Customers who purchase a network good after
Q210: Core users of a network good are
Unlock this Answer For Free Now!
View this answer and more for free by performing one of the following actions

Scan the QR code to install the App and get 2 free unlocks

Unlock quizzes for free by uploading documents