(Figure) The figure shows two demand curves for the same product for two different periods. When the price falls from $10 to $5, the price elasticity of demand using the midpoint method will be _____ for the short run and _____for the long run.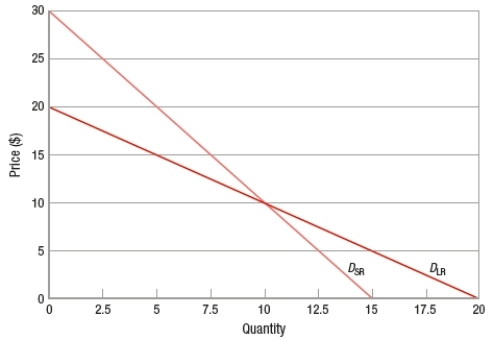
A) 0.33; 0.6
B) 3.03; 0.6
C) 0.33; 1.67
D) 3.03; 1.67
Correct Answer:
Verified
Q81: Using the midpoints of price and quantity
Q82: As the price of bananas fell from
Q83: If the price falls from $3 to
Q84: If the price rises from $2 to
Q85: A product's price changes from $2 to
Q87: (Figure) The figure shows two demand curves
Q88: (Figure) The figure shows two demand curves
Q89: The current equilibrium price and quantity in
Q90: The current equilibrium price and quantity in
Q91: (Figure) The figure shows a basic
Unlock this Answer For Free Now!
View this answer and more for free by performing one of the following actions

Scan the QR code to install the App and get 2 free unlocks

Unlock quizzes for free by uploading documents