(Figure) The figure shows two demand curves for two different periods for the same product. Based on the information in the graph, which statement is TRUE?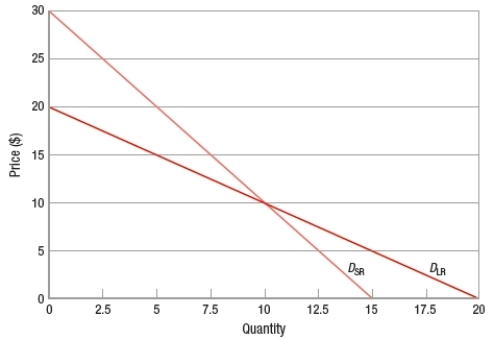
A) The flatter long-run demand curve implies that consumers have more time to adjust their behavior and find substitute goods.
B) The flatter long-run demand curve implies that more consumers find the product a necessity in the long run compared to the short run.
C) The steeper short-run demand curve implies that consumers spend a larger share of their income in the short run compared to the long run.
D) The steeper short-run demand curve implies consumers are more price sensitive in the short run compared to the long run.
Correct Answer:
Verified
Q83: If the price falls from $3 to
Q84: If the price rises from $2 to
Q85: A product's price changes from $2 to
Q86: (Figure) The figure shows two demand curves
Q87: (Figure) The figure shows two demand curves
Q89: The current equilibrium price and quantity in
Q90: The current equilibrium price and quantity in
Q91: (Figure) The figure shows a basic
Q92: As the price of bananas fell from
Q93: A gas station owner in a large
Unlock this Answer For Free Now!
View this answer and more for free by performing one of the following actions

Scan the QR code to install the App and get 2 free unlocks

Unlock quizzes for free by uploading documents