(Figure: Impact of Tax on Market Equilibrium) Based on the graph, implementing a tax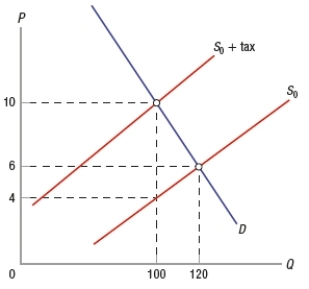
A) lowers equilibrium price from $6 to $4 and lowers equilibrium quantity from 120 to 100 units.
B) lowers equilibrium price from $10 to $6 and lowers equilibrium quantity from 120 to 100 units.
C) raises equilibrium price from $6 to $10 and lowers equilibrium quantity from 120 to 100 units.
D) raises equilibrium price from $6 to $10 and raises equilibrium quantity from 100 to 120 units.
Correct Answer:
Verified
Q233: Tax burdens are higher on consumers when
A)
Q234: In general, tax incidence falls more on
Q235: In general, the burden of taxes falls
Q236: If demand is inelastic, the tax incidence
Q237: If demand is elastic, the tax incidence
Q239: (Figure: Impact of Tax on Market Equilibrium)
Q240: (Figure: Impact of Tax on Market Equilibrium)
Q241: Tax incidence describes
A) who makes the tax
Q242: The economic burden of a tax borne
Q243: A tax on a product
A) has no
Unlock this Answer For Free Now!
View this answer and more for free by performing one of the following actions

Scan the QR code to install the App and get 2 free unlocks

Unlock quizzes for free by uploading documents