Refer to the graph.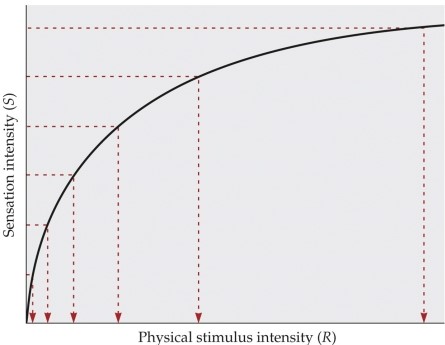 This graph illustrates
A) Weber's law.
B) Berkeley's function.
C) Descartes' beliefs.
D) Fechner's law.
E) Helmholtz's curve.
Correct Answer:
Verified
Q20: Weber proposed that the smallest change in
Q21: If a participant were holding two different
Q22: Stevens' power law describes the relationship between
Q23: _ is the principle that describes the
Q24: _ describes the relationship between a stimulus
Q26: Absolute threshold is the minimum amount of
Q27: If we measure the minimum volume it
Q28: The method of _ requires the random
Q29: Imagine you are tasting bowls of soup
Q30: The method of _ requires the experimenter
Unlock this Answer For Free Now!
View this answer and more for free by performing one of the following actions

Scan the QR code to install the App and get 2 free unlocks

Unlock quizzes for free by uploading documents