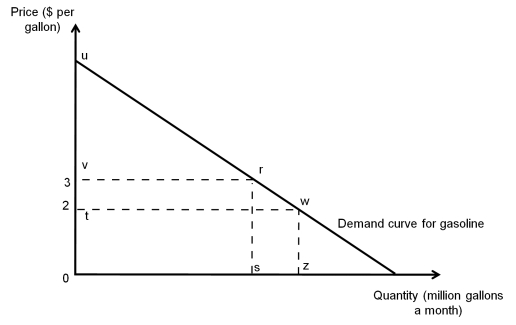
The following figure depicts the market demand for gasoline. Suppose that the price of gasoline rises from US$2 to US$3 per gallon. Which areas represent the changes in (a) expenditure, and (b) buyer surplus?
Correct Answer:
Verified
View Answer
Unlock this answer now
Get Access to more Verified Answers free of charge
Q10: The following figure depicts the market demand
Q11: The average home in Hong Kong is
Q12: Fields can be ploughed with human labor,
Q13: Customers for prepaid mobile telephone service pay
Q14: Explain the relations among the demands for
Q15: How would a switch from gasoline-powered to
Q16: Tesla and NIO produce only electric cars.
Q17: Suppose that a food delivery service cuts
Q18: Luna Supplies offers to lease a plotter
Q19: The below figure depicts Maggie's demand for
Unlock this Answer For Free Now!
View this answer and more for free by performing one of the following actions

Scan the QR code to install the App and get 2 free unlocks

Unlock quizzes for free by uploading documents