The following figure shows wage rate versus quantity of labor.
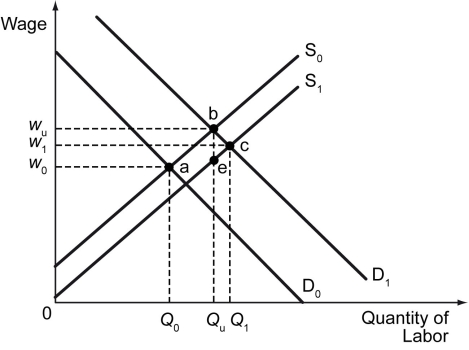
-Refer to the figure above.If S₀ is the supply of labor,D₀ is the labor demand curve during a cyclical downturn,and D₁ is the labor demand curve during a cyclical expansion,which expression best represents the natural rate of unemployment?
A) Qᵤ - Q₀
B) Qᵤ + Q₀
C) (Qᵤ + Q₀) /2
D) (Qᵤ - Q₀) /2
Correct Answer:
Verified
Q227: Which of the following is true of
Q228: The following figure shows wage rate versus
Q229: The following figure shows curves for labor
Q230: The natural rate of unemployment _.
A) is
Q231: The figure below shows labor supply and
Q233: The figure below shows labor supply and
Q234: Scenario: Truck drivers across the country are
Q235: The following table shows some labor statistics
Q236: The following figure shows wage rate versus
Q237: The following figure shows wage rate versus
Unlock this Answer For Free Now!
View this answer and more for free by performing one of the following actions

Scan the QR code to install the App and get 2 free unlocks

Unlock quizzes for free by uploading documents