The following table shows some labor statistics for four years.
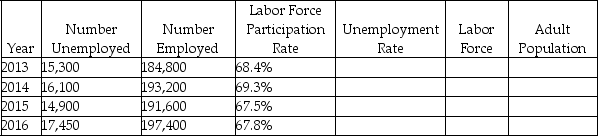
-Refer to the table above.Based on unemployment rates,which year appears to be a cyclical downturn?
A) 2013
B) 2014
C) 2015
D) 2016
Correct Answer:
Verified
Q218: A reduction in wage is most likely
Q219: The following figure shows wage versus labor
Q220: Which of the following statements is true?
A)
Q221: Which of the following is true of
Q222: The following table shows some labor statistics
Q224: If the natural rate of unemployment in
Q225: The following figure shows wage rate versus
Q226: The following table shows some labor statistics
Q227: Which of the following is true of
Q228: The following figure shows wage rate versus
Unlock this Answer For Free Now!
View this answer and more for free by performing one of the following actions

Scan the QR code to install the App and get 2 free unlocks

Unlock quizzes for free by uploading documents