The following figure shows wage rate versus quantity of labor.
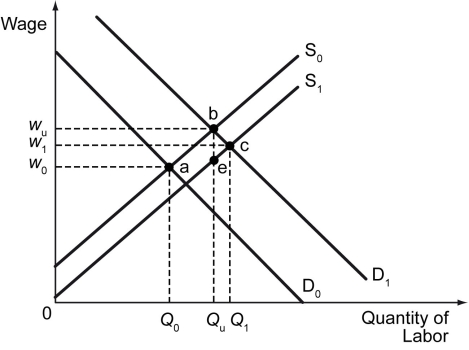
-Refer to the figure above.If S₀ is the supply of labor,D₀ is the labor demand curve during a cyclical downturn,and D₁ is the labor demand curve during a cyclical expansion,which expression best represents the natural level of employment?
A) Qᵤ - Q₀
B) Qᵤ + Q₀
C) (Qᵤ + Q₀) /2
D) (Qᵤ - Q₀) /2
Correct Answer:
Verified
Q220: Which of the following statements is true?
A)
Q221: Which of the following is true of
Q222: The following table shows some labor statistics
Q223: The following table shows some labor statistics
Q224: If the natural rate of unemployment in
Q226: The following table shows some labor statistics
Q227: Which of the following is true of
Q228: The following figure shows wage rate versus
Q229: The following figure shows curves for labor
Q230: The natural rate of unemployment _.
A) is
Unlock this Answer For Free Now!
View this answer and more for free by performing one of the following actions

Scan the QR code to install the App and get 2 free unlocks

Unlock quizzes for free by uploading documents