The following figure shows two credit demand curves, CD₁ and CD₂, and two credit supply curves, CS₁ and CS₂.
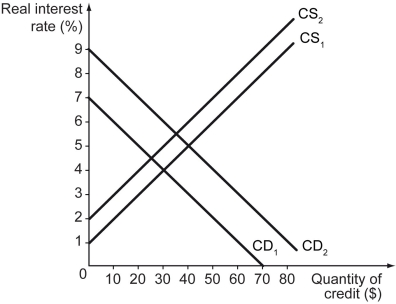
-Refer to the figure above.What is the equilibrium quantity of credit when the credit demand curve is CD₁ and the credit supply curve is CS₁?
A) $20
B) $30
C) $40
D) $50
Correct Answer:
Verified
Q61: Which of the following statements is true?
A)
Q62: The following figure shows credit demand and
Q63: At the equilibrium rate of interest,_.
A) the
Q64: Illustrate graphically how the equilibrium quantity of
Q65: What is the loanable funds market? What
Q67: Everything else remaining unchanged,what is likely to
Q68: If the real interest rate is lower
Q69: The following figure shows two credit demand
Q70: Everything else remaining unchanged,what is likely to
Q71: The following figure shows two credit demand
Unlock this Answer For Free Now!
View this answer and more for free by performing one of the following actions

Scan the QR code to install the App and get 2 free unlocks

Unlock quizzes for free by uploading documents