The following figure shows credit demand and credit supply curves.
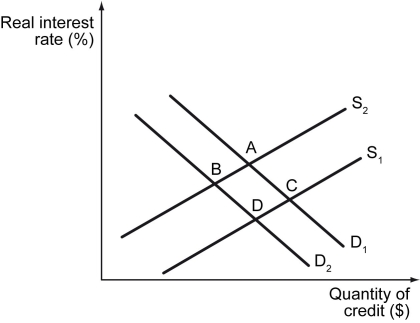
-Refer to the figure above.Assume that the loanable funds market initially is in equilibrium at point A.The media report that a new housing bubble may warrant precaution.Holding all else constant,how might the equilibrium change?
A) Demand will increase, so people can pay off their houses faster. The new equilibrium will be at point C.
B) Supply will increase, because potential buyers will choose to save instead of investing. The new equilibrium will be at point C.
C) Demand will decrease, because potential buyers may fear stricter requirements to qualify for loans and so choose to not buy a house yet. The new equilibrium will be at point B.
D) Supply will decrease, because banks are less likely to approve new loans. The new equilibrium will be at point B.
Correct Answer:
Verified
Q84: The following figure plots real interest rate
Q85: Scenario: John is looking to buy a
Q86: The following table lists some economic agents
Q87: The following figure plots real interest rate
Q88: Scenario: John is looking to buy a
Q90: The following figure shows credit demand and
Q91: The following figure plots real interest rate
Q92: Scenario: John is looking to buy a
Q93: The following figure plots real interest rate
Q94: Scenario: John is looking to buy a
Unlock this Answer For Free Now!
View this answer and more for free by performing one of the following actions

Scan the QR code to install the App and get 2 free unlocks

Unlock quizzes for free by uploading documents