The following figure shows credit demand and credit supply curves.
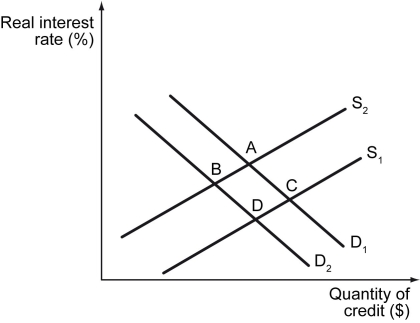
-Refer to the figure above.It illustrates that ________.
A) it is easier to borrow if the real interest rate is high
B) there will be an excess supply of saving if the real interest rate is high
C) quantity demanded for credit is higher and quantity supplied is lower at higher real interest rates
D) the credit market only clears if the real interest rate is high
Correct Answer:
Verified
Q85: Scenario: John is looking to buy a
Q86: The following table lists some economic agents
Q87: The following figure plots real interest rate
Q88: Scenario: John is looking to buy a
Q89: The following figure shows credit demand and
Q91: The following figure plots real interest rate
Q92: Scenario: John is looking to buy a
Q93: The following figure plots real interest rate
Q94: Scenario: John is looking to buy a
Q95: The following table lists some economic agents
Unlock this Answer For Free Now!
View this answer and more for free by performing one of the following actions

Scan the QR code to install the App and get 2 free unlocks

Unlock quizzes for free by uploading documents