The following figure shows credit demand and credit supply curves.
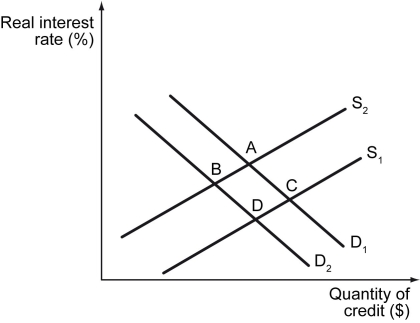
-Refer to the figure above.Which of the statements below could explain a shift of equilibrium in the credit market from point C to point D?
A) Decreased federal requirements for how much a company has to contribute to its employees' 401Ks.
B) Domestic firms are suffering loss of revenue and business opportunity due to new trade laws.
C) Millennials eat out more and save less than previous generations.
D) Over time, people prefer smaller and smaller houses.
Correct Answer:
Verified
Q71: The following figure shows two credit demand
Q76: The following figure shows credit demand and
Q77: Everything else remaining unchanged,what is likely to
Q79: If the real interest rate is greater
Q80: The following figure shows two credit demand
Q82: The following figure plots real interest rate
Q83: Scenario: John is looking to buy a
Q84: The following figure plots real interest rate
Q85: Scenario: John is looking to buy a
Q86: The following table lists some economic agents
Unlock this Answer For Free Now!
View this answer and more for free by performing one of the following actions

Scan the QR code to install the App and get 2 free unlocks

Unlock quizzes for free by uploading documents