The following figure plots real interest rate against quantity of credit.
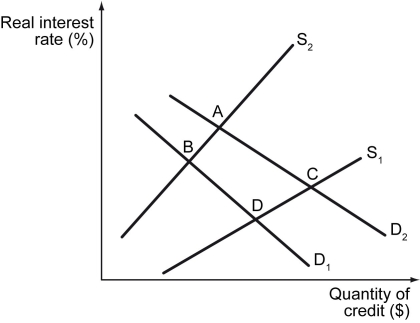
-Refer to the figure above.Compared to point C,at point A,debtors are ________.
A) more likely to invest
B) less likely to invest
C) more likely to save
D) less likely to save
Correct Answer:
Verified
Q71: The following figure shows two credit demand
Q77: Everything else remaining unchanged,what is likely to
Q79: If the real interest rate is greater
Q80: The following figure shows two credit demand
Q81: The following figure shows credit demand and
Q83: Scenario: John is looking to buy a
Q84: The following figure plots real interest rate
Q85: Scenario: John is looking to buy a
Q86: The following table lists some economic agents
Q87: The following figure plots real interest rate
Unlock this Answer For Free Now!
View this answer and more for free by performing one of the following actions

Scan the QR code to install the App and get 2 free unlocks

Unlock quizzes for free by uploading documents