Figure 18-3
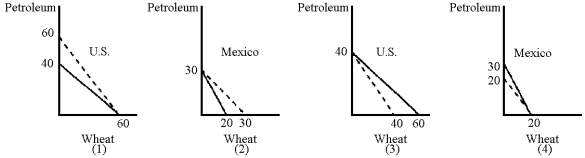
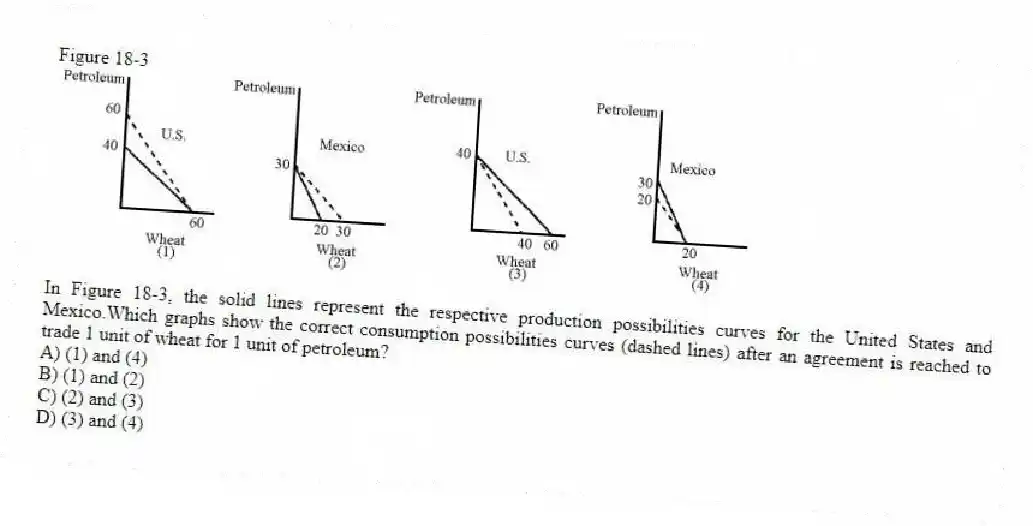
-In Figure 18-3, the solid lines represent the respective production possibilities curves for the United States and Mexico.Which graphs show the correct consumption possibilities curves (dashed lines) after an agreement is reached to trade 1 unit of wheat for 1 unit of petroleum?
A) (1) and (4)
B) (1) and (2)
C) (2) and (3)
D) (3) and (4)
Correct Answer:
Verified
Q11: Is it possible for a country to
Q101: If two countries each are currently producing
Q105: Suppose that Captain Canada can produce 100
Q106: Figure 18-2 Q107: Figure 18-6 Q109: Table 18-1 Q113: Figure 18-2 Q114: A country can gain by importing a Q115: Figure 18-5 Q116: Figure 18-4 Unlock this Answer For Free Now! View this answer and more for free by performing one of the following actions Scan the QR code to install the App and get 2 free unlocks Unlock quizzes for free by uploading documents
![]()
![]()
![]()
![]()
![]()

