The following question are based on the following diagram:
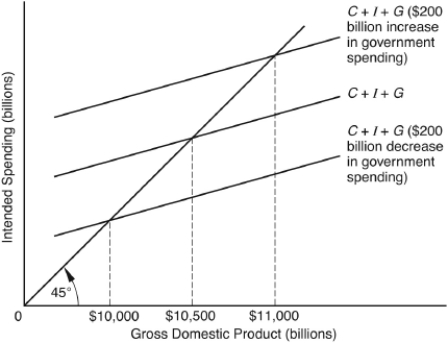
-From the diagram,one can infer that the
A) C + I + G line cannot change.
B) marginal propensity to save is 1.
C) multiplier is 2.5.
D) 45-degree line is unstable.
E) total intended spending always equals GDP.
Correct Answer:
Verified
Q5: Higher personal tax rates
A) cause the relationship
Q6: Q7: Excessive unemployment is a sign of a(n) Q8: If the multiplier is 3,a $1 billion Q9: In a simple Keynesian model,a decrease in Q11: Using the spending and taxing powers of Q12: Fiscal policy is the Q13: The use of government spending and taxes Q14: Lower personal tax rates reduce Q15: The fundamental idea of fiscal policy is![]()
A)
A) policy that corporations
A) intended spending.
B)
Unlock this Answer For Free Now!
View this answer and more for free by performing one of the following actions

Scan the QR code to install the App and get 2 free unlocks

Unlock quizzes for free by uploading documents