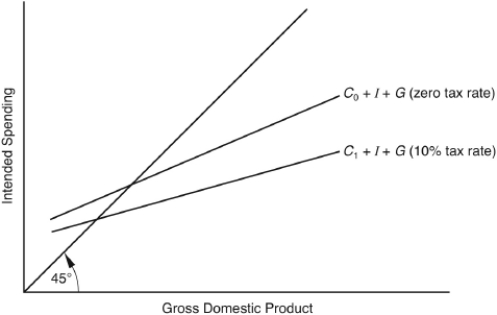
-The preceding diagram shows that a(n)
A) decrease in the tax rate results in a desire to spend less out of each level of GDP.
B) decrease in the tax rate leads to an equilibrium in which GDP diverges from intended spending.
C) decrease in the tax rate induces an increase in the equilibrium value of GDP.
D) increase in the tax rate induces an increase in the equilibrium value of GDP.
E) increase in the tax rate causes a decline in government expenditures.
Correct Answer:
Verified
Q1: An MPS of 0.6 allows a $1
Q2: Tax collections alter the equilibrium level of
Q3: Q4: The higher the tax rate,government spending unchanged,the Q5: Higher personal tax rates Q7: Excessive unemployment is a sign of a(n) Q8: If the multiplier is 3,a $1 billion Q9: In a simple Keynesian model,a decrease in Q10: The following question are based on the Q11: Using the spending and taxing powers of![]()
A)
A) cause the relationship
A)
Unlock this Answer For Free Now!
View this answer and more for free by performing one of the following actions

Scan the QR code to install the App and get 2 free unlocks

Unlock quizzes for free by uploading documents