The figure given below represents the equilibrium real GDP and price level in the aggregate demand and aggregate supply model.
Figure 8.3
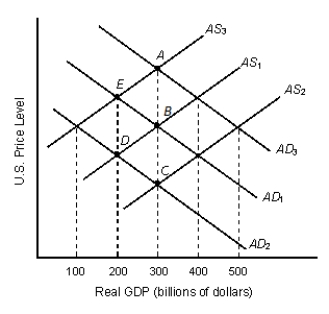
-Refer to Figure 8.3. Potential GDP is greater than real GDP at all output levels:
A) above $300 billion.
B) between $300 billion and $400 billion.
C) above $400 billion.
D) below $300 billion.
E) above $500 billion.
Correct Answer:
Verified
Q69: Aggregate demand-aggregate supply analysis shows that in
Q70: Suppose in Country X, wages of workers
Q80: The movement of the vertical _ curve
Q83: An increase in aggregate demand normally does
Q84: The figure given below represents the long-run
Q84: A change in foreign demand does not
Q85: A demand-pull inflation is caused by an
Q90: An increase in the real value of
Q91: The purchase of fifty new food-processing machines
Q92: The economic reasons that underlie the shape
Unlock this Answer For Free Now!
View this answer and more for free by performing one of the following actions

Scan the QR code to install the App and get 2 free unlocks

Unlock quizzes for free by uploading documents