The figure given below represents the equilibrium real GDP and price level in the aggregate demand and aggregate supply model.
Figure 8.3
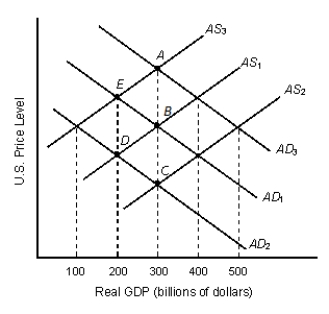
-Refer to Figure 8.3. Movement from point B to point D could be initiated by:
A) a stock market crash that undermines consumer confidence.
B) a tax code changes that improve investor expectations.
C) a national emergency that increases government spending.
D) a higher net exports because of economic expansion in European countries.
E) a technological advancement.
Correct Answer:
Verified
Q81: The interest rate effect suggests that investment
Q87: Government spending is set by the federal
Q89: Increased household spending reduces aggregate expenditures.
Q90: The figure given below represents the long-run
Q90: An increase in the real value of
Q91: The figure given below represents the equilibrium
Q94: If there is a sudden jump in
Q95: The figure given below represents the equilibrium
Q98: A lower domestic price level raises aggregate
Q100: In 2009, a nation reported total imports
Unlock this Answer For Free Now!
View this answer and more for free by performing one of the following actions

Scan the QR code to install the App and get 2 free unlocks

Unlock quizzes for free by uploading documents