The figure given below represents the leakages and injections in an economy.?Figure 10.2??In the figure:?I, I1: Investment;?G: Government spending;?EX, EX1: Exports;?T: Taxes; and?M: Imports.
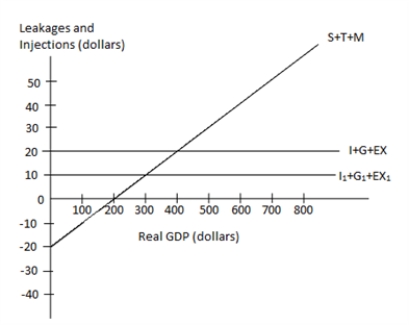
-Refer to Figure 10.2. A decline in total injections, from $20 to $10:
A) will cause equilibrium income to rise to $400.
B) will result in a disequilibrium of $200 in the economy.
C) will cause the total leakages curve to shift inward.
D) will cause equilibrium income to fall to $300.
E) will not affect equilibrium income.
Correct Answer:
Verified
Q22: Suppose in an economy, investment = $40,
Q24: The figure given below represents the leakages
Q26: The figure given below represents the leakages
Q27: The spending multiplier measures the change in
Q27: Scenario 10.1
Imagine an economy that does not
Q30: The figure given below represents the leakages
Q31: The figure given below represents the leakages
Q36: The figure given below represents the leakages
Q36: Suppose an economy has a government budget
Q39: Suppose an economy operates at a real
Unlock this Answer For Free Now!
View this answer and more for free by performing one of the following actions

Scan the QR code to install the App and get 2 free unlocks

Unlock quizzes for free by uploading documents