The figure given below represents the leakages and injections in an economy.
Figure 10.2
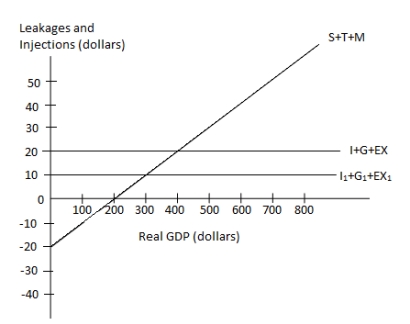 In the figure:
I, I1: Investment;
G: Government spending;
EX, EX1: Exports;
T: Taxes; and
M: Imports.
-According to Figure 10.2, real GDP of $200 indicates a point where:
A) total leakages exceed total injections.
B) aggregate expenditures exceed total output.
C) consumers engage in dissaving.
D) the economy is in macroeconomic equilibrium.
E) unplanned inventory changes will be positive.
Correct Answer:
Verified
Q22: Suppose in an economy, investment = $40,
Q24: At each round of the multiplier process,
Q27: Scenario 10.1
Imagine an economy that does not
Q29: Assume that an increase of $300 in
Q30: The figure given below represents the leakages
Q32: Ceteris paribus, a downward shift in the
Q36: Suppose an economy has a government budget
Q36: The figure given below represents the leakages
Q37: The spending multiplier measures the change in
Q38: If Saving+Tax+Import > Investment+Government spending+Export, then _
Unlock this Answer For Free Now!
View this answer and more for free by performing one of the following actions

Scan the QR code to install the App and get 2 free unlocks

Unlock quizzes for free by uploading documents