The figure given below represents the leakages and injections in an economy.?Figure 10.3??In the figure:?S₁ and S₂: Saving functions?I: Investment?G: Government spending?EX: Net exports
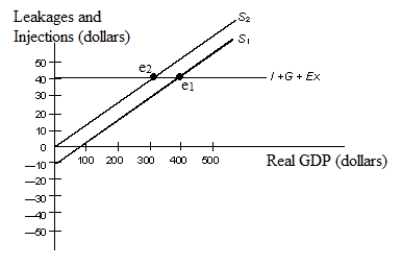
-In Figure 10.3, which of the following represents the paradox of thrift?
A) A shift of the saving curve from S₂ to S₁
B) A shift of the saving curve from S₁ to S₂
C) A change in equilibrium real GDP from $100 to $200
D) A change in equilibrium real GDP from $300 to $100
E) A change in equilibrium real GDP from $100 to $400
Correct Answer:
Verified
Q21: Assume that the marginal propensity to consume
Q22: Suppose in an economy, investment = $40,
Q25: Savings are good for a family.If all
Q27: Scenario 10.1
Imagine an economy that does not
Q29: Assume that an increase of $300 in
Q30: The figure given below represents the leakages
Q32: Ceteris paribus, a downward shift in the
Q36: Suppose an economy has a government budget
Q36: The percentage of a change in income
Q39: Suppose an economy operates at a real
Unlock this Answer For Free Now!
View this answer and more for free by performing one of the following actions

Scan the QR code to install the App and get 2 free unlocks

Unlock quizzes for free by uploading documents