The figure given below represents the macroeconomic equilibrium in the aggregate income and aggregate expenditure framework. Assume that MPI is equal to zero.
Figure 10.4
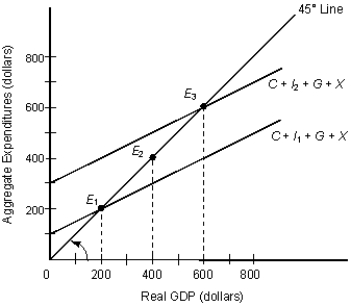 In the figure:
C: Consumption
I1 and I2: Investment
G: Government Spending
X: Exports
-In Figure 10.4, calculate the marginal propensity to consume.
A) 0.67
B) 0.50
C) 0.25
D) 0.33
E) 4
Correct Answer:
Verified
Q75: The figure given below represents the leakages
Q76: The figure given below represents the leakages
Q77: The figure given below depicts macroeconomic equilibrium
Q78: The figure given below represents the macroeconomic
Q79: Calculate the spending multiplier from the information
Q83: The figure given below shows the macroeconomic
Q84: When the purchasing power of money declines:
A)demand
Q86: The spending multiplier equals 1/marginal propensity to
Q87: Suppose an appreciation of the French franc
Q95: If 81 percent of Canada's exports go
Unlock this Answer For Free Now!
View this answer and more for free by performing one of the following actions

Scan the QR code to install the App and get 2 free unlocks

Unlock quizzes for free by uploading documents