The figure given below represents the leakages and injections in an economy.
Figure 10.6
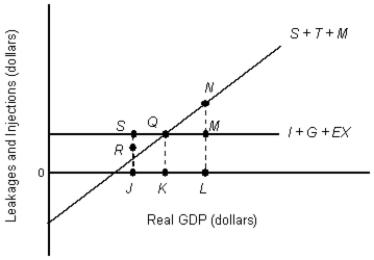
-Refer to Figure 10.6. If 0L represents potential GDP, then the GDP gap can be closed by increasing autonomous expenditures by an amount equal to the line segment _____.
A) NM
B) NL
C) ML
D) OK
E) QK
Correct Answer:
Verified
Q61: The figure given below shows the macroeconomic
Q68: Calculate the marginal propensity to save for
Q69: The figure given below represents the macroeconomic
Q71: Assume that a GDP gap can be
Q76: The table given below shows the real
Q78: The figure given below represents the macroeconomic
Q82: Assume that the multiplier effect for Mexico
Q83: The figure given below shows the macroeconomic
Q91: Suppose only 7 percent of Turkey's products
Q96: If equilibrium in the economy is merely
Unlock this Answer For Free Now!
View this answer and more for free by performing one of the following actions

Scan the QR code to install the App and get 2 free unlocks

Unlock quizzes for free by uploading documents