The figure given below depicts the equilibrium in the foreign exchange market.?Figure 13.1
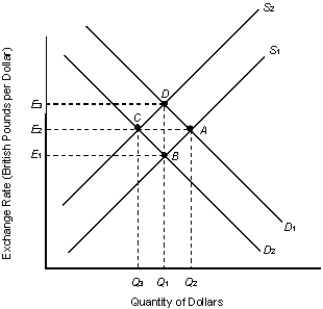
-Refer to Figure 13.1. If the current equilibrium exchange rate is E1 what action would the Fed have to take to achieve a target exchange rate of E2?
A) Sell (Q₂ - Q₁) amount of U.S. dollars.
B) Buy (Q₁ - Q₃) amount of U.S. dollars.
C) Buy (Q₂ - Q₃) amount of U.S. dollars.
D) Buy (Q₂ - Q₁) amount of U.S. dollars.
E) Sell (Q₁ - Q₃) amount of U.S. dollars.
Correct Answer:
Verified
Q61: In foreign exchange markets, a U.S.resident who
Q64: Assume that the yen price of one
Q67: The figure given below depicts the equilibrium
Q72: The supply of the U.S.dollar on the
Q74: The figure given below depicts the equilibrium
Q74: The figure given below depicts the equilibrium
Q74: When more than one central bank attempts
Q75: The supply curve of U.S.dollars in the
Q77: If the U.S.dollar depreciates against the yen
Q95: An increase in nominal income will result
Unlock this Answer For Free Now!
View this answer and more for free by performing one of the following actions

Scan the QR code to install the App and get 2 free unlocks

Unlock quizzes for free by uploading documents